The Facebook Events Manager is an invaluable tool for businesses utilizing Facebook or Instagram ads. Despite its name, it's not for planning social get-togethers. Instead, it's where all the pixel and server-side event data gets sent from your website to your Facebook account, providing a suite of tools to help you track and measure the quality of your data. In this post, we will dive deep into the Events Manager and shed light on its features and functionalities.
An Overview of Facebook Events Manager
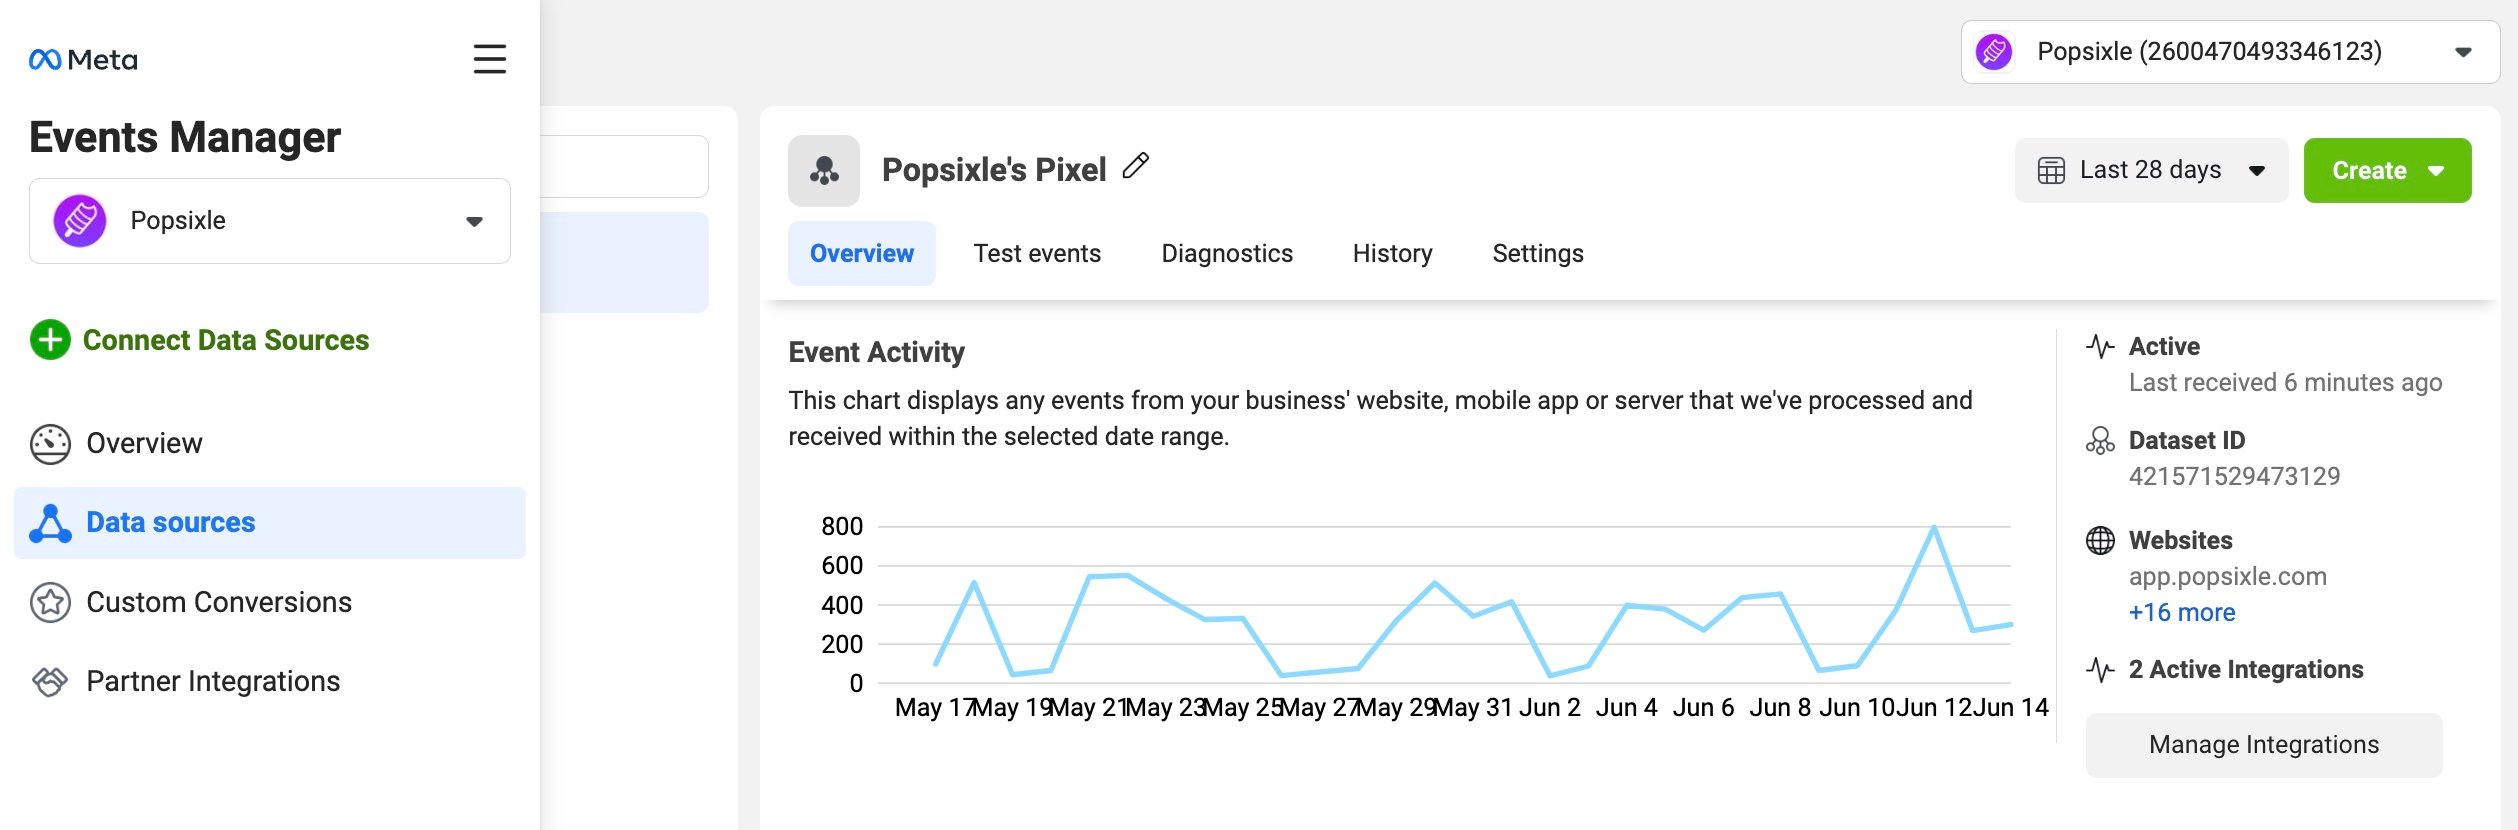
When you first open the Events Manager, you'll see four different tabs. For this post, our main focus will be on the "Data Sources" tab (it may be called “Event Sources”, given some recent changes). We will cover the process of creating new pixels or setting up custom conversion events in a future post.
Within the "Data Sources" tab, you'll see a list on the left if you have access to more than one pixel. You'll want to open the specific pixel that you're tracking. You can confirm that this pixel matches your live website by visiting your site and using the Meta pixel helper. This tool shows the id of the pixel on your website and should be cross referenced the id of the one you select in the Events Manager.
Three criteria can help you confirm that you're looking at a live pixel:
- Activity: A live pixel will show a substantial amount of activity.
- Usage: Check if the pixel is being used by ad sets. A pixel might be receiving data, but if there are no campaigns attached to it, it's likely not a live one.
- Pixel Number: The pixel number in the Events Manager should match the one on your website.
The Tabs Within Events Manager
The primary screen of the Events Manager is divided into five tabs, with an additional area where you can adjust the date range. Let's go over each tab:
- Overview: This tab provides an aggregate view of all the pixel events that occurred during the selected date range. It further breaks down each individual event type, which should represent your full funnel. For a standard Shopify store, the sequence typically includes: PageView, ViewContent, AddToCart, InitiateCheckout, Purchase
- Test Event Tab: This tab is mostly beneficial when you're setting up a pixel for the first time or making significant changes to your website. It lets you test events, but you won't need to use it often.
- Diagnostics Tab: This tab is incredibly useful. It flags issues, with orange alerts indicating minor problems and red alerts signaling major ones. Not all alerts raised in the Diagnostics tab are major problems, but they provide insights into potential issues that might need attention.
- History Tab: This tab is not frequently used but is valuable for accountability purposes. It records all changes made by different users on your account, so if something suddenly appears different, you can track down who made the change and when.
- Settings Tab: This tab is handy for setting up a Conversions API connection and changing various settings. It does provide manual controls over a small number of data modeling settings and allows you to generate an access token for a new Conversions API connection.
Now that we've covered the basics, let's return to the "Overview" tab, where you'll likely spend most of your time.
Decoding the Overview Tab
For some, but not all Facebook accounts, the "Overview" tab includes a relatively new column called "Status," introduced in early 2023. If it's available on your account, this column quantifies the incremental value created by the server connection you've set up with a Conversions API.
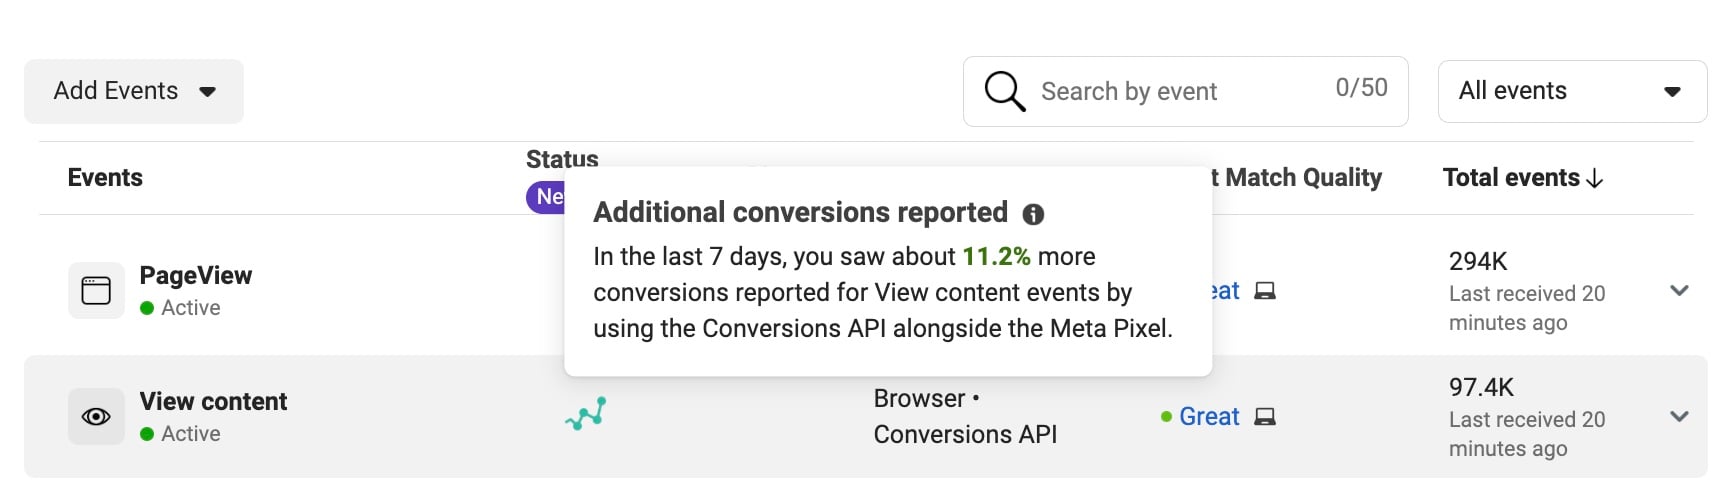
Hovering over the status column reveals the increased percentage of conversions reported through the Conversions API. For example, if it shows that you've had 11.2% more conversions reported for "page view" in the last seven days through the Conversions API, it confirms the value you're getting for implementing and possibly paying for a service like Popsixle.
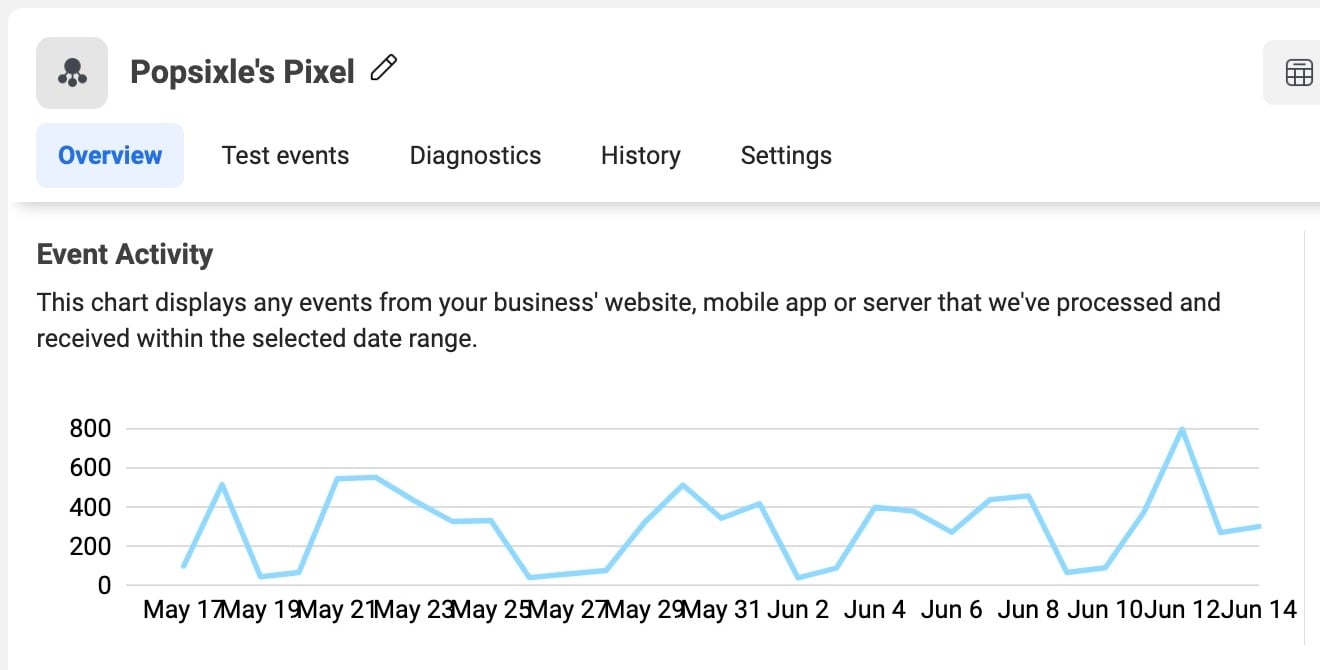
Also, the Overview tab gives you a glimpse into the Event Match Quality scores for each event type. However, before we dive into that, let's explore the graph details.
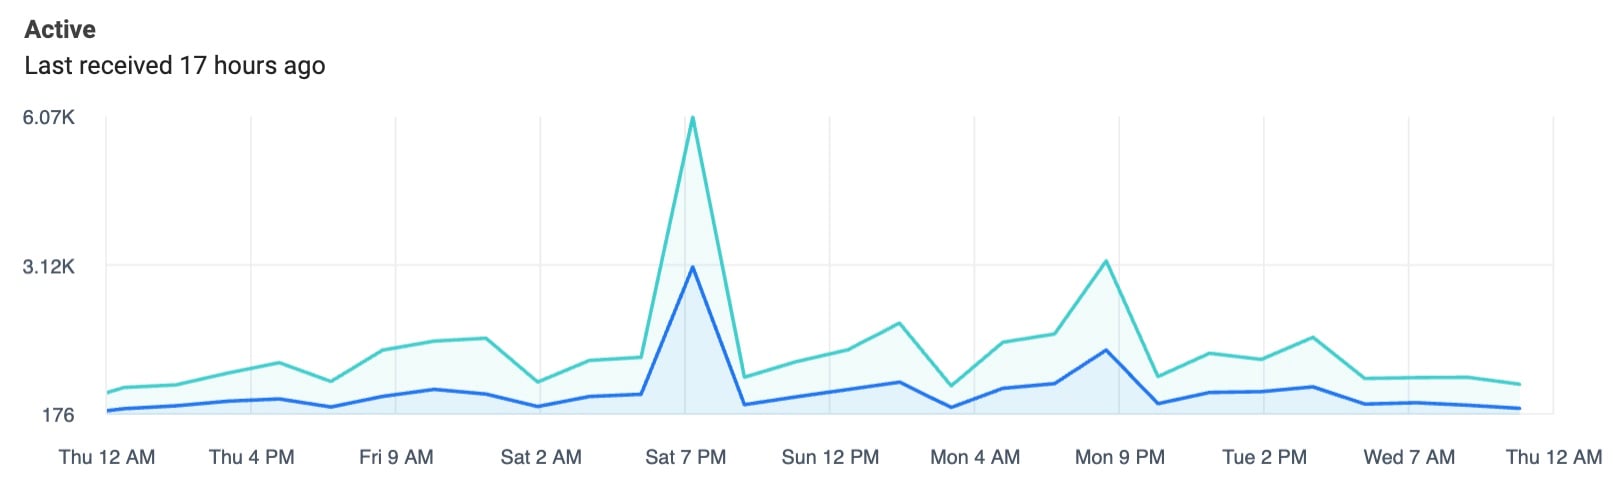
You may notice that the graph displays two different colors - Facebook blue and aquamarine. These two colors represent different data sources. The Facebook blue represents browser events, which come from the pixel via the web, while the aquamarine signifies server events from an active Conversions API connection like Popsixle.
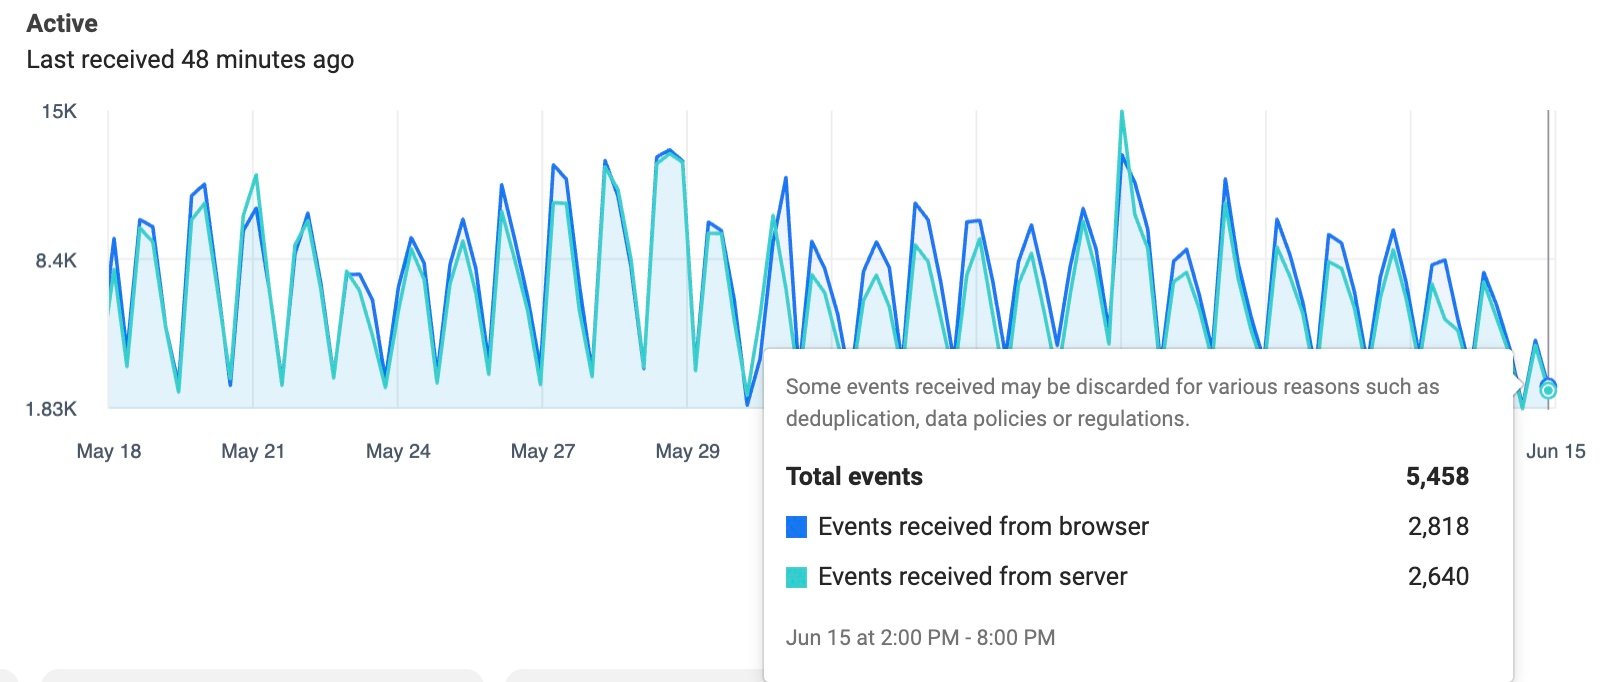
Every data connection you have, be it a browser connection or a Conversions API connection, sends data separately. This color-coded view allows you to see what's being received from each source. Typically, the event volumes from both sources will correlate closely, with very few exceptions. When they don’t correlate, it’s a clue worth looking into.
Working with Multiple Conversions API Connections
Suppose you're working with a service like Popsixle, and you have another Conversions API connection (CAPI), such as the built in CAPI connection from Shopify. We recommend that you turn off other CAPI connections when using Popsixle, but it’s your choice whether you follow this best practice. If you keep more than one CAPI connection on, you should expect your server events will outnumber your browser events due to events getting tallied from multiple sources. This could make your aquamarine server events graph appear to be doubled up or tripled up relative to your browser events graph.
Likewise, if you see that your browser events are twice as high as your server events, it could indicate that your pixel has been installed twice, causing events to fire twice for every action. The Overview graph isn’t just a simple visual; it helps you identify whether you have more than one server connection or if there's a discrepancy between what you're seeing from the server and the browser.
Reviewing the Details
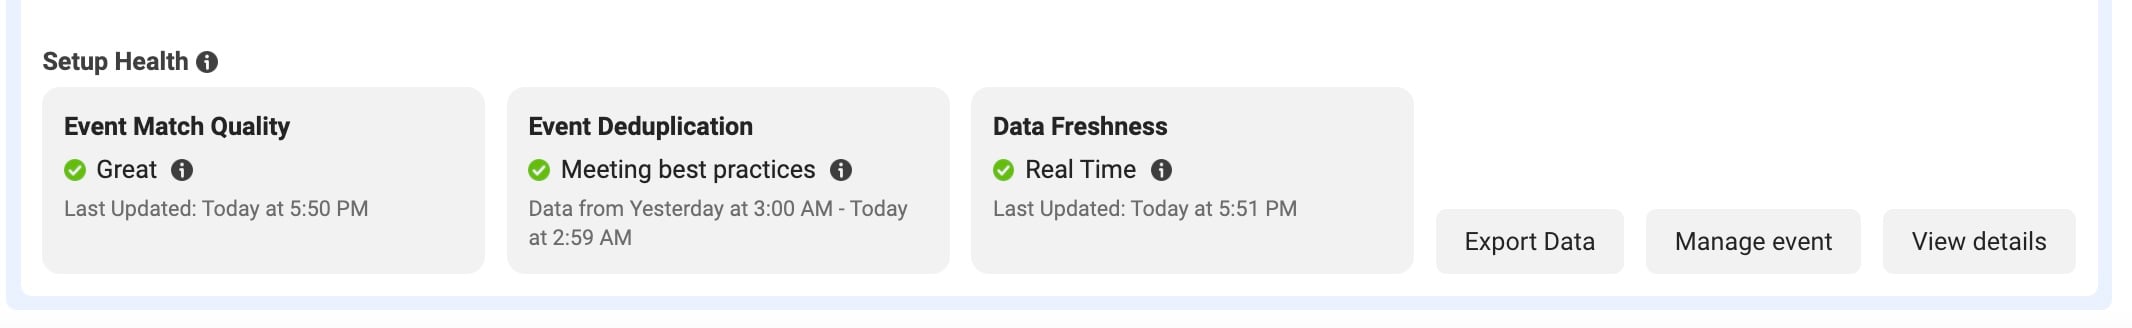
Below the Overview graph, you'll see a wealth of information related to your event data quality, your deduplication efforts, and the timeliness of your data. Each of these metrics is important:
- Event Match Quality (EMQ): Facebook scores your data, rating it as poor, good, great, or even excellent. However, you can also find a specific number score which might provide a clearer understanding of your data quality.
- Deduplication: If you're getting events from multiple locations, it's essential to ensure they are effectively deduplicated. Facebook needs to understand that a server event and a browser event for the same purchase are indeed the same action, not separate ones.
- Real-time Data: Real-time data is crucial for your Facebook algorithm to optimize dynamically. While daily uploads might help you tally and attribute purchases, they won't provide the real-time information necessary for optimal algorithm performance.
You can export your data, which provides you a spreadsheet, allowing you to replicate the graph in Excel if needed.
Diving Deeper into Event Details
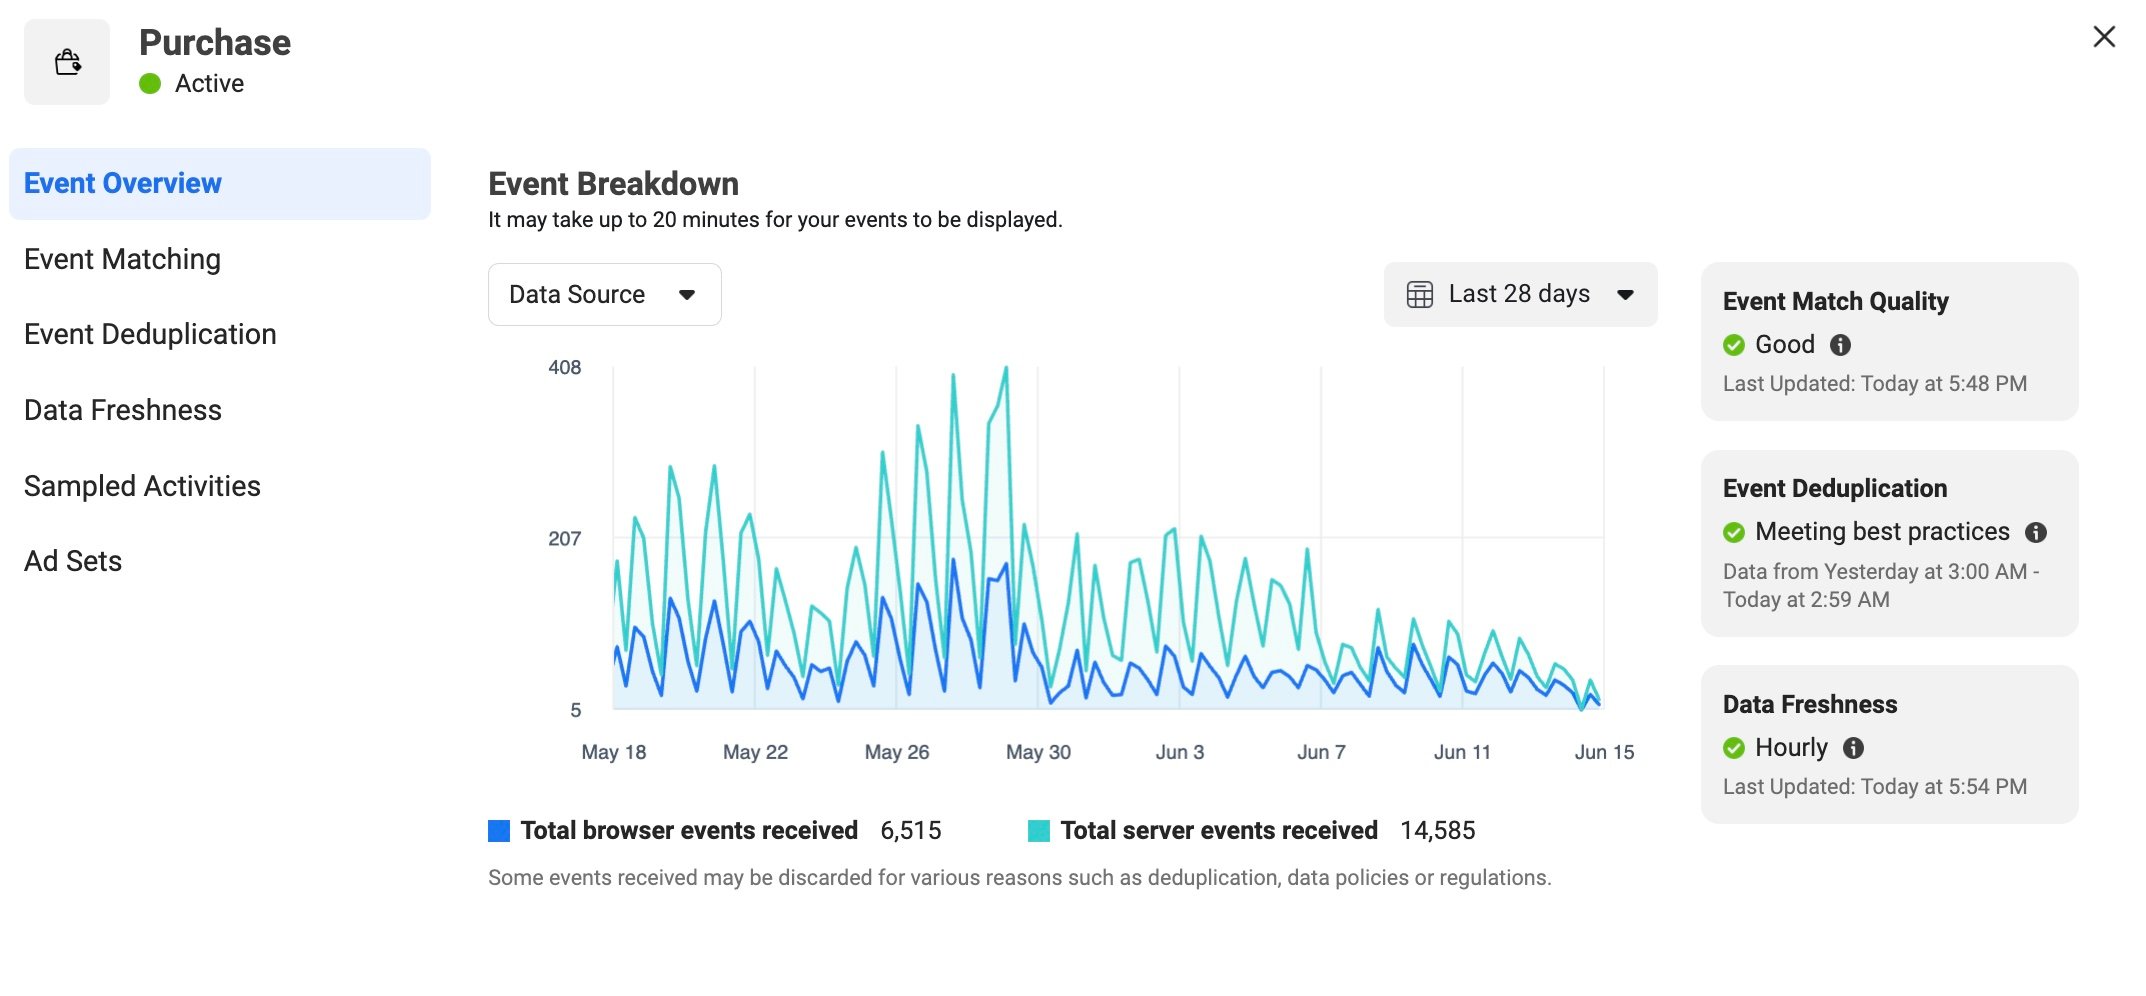
By selecting "View Details," you'll access a more detailed data breakdown. Hovering over this area will show you precise numbers and date ranges. You can filter by data source, URLs, domains, or devices, providing a more graniform view of your event data. This section is particularly useful when troubleshooting issues like duplicate server events.
At the left side of the View Details pop-up box, you’ll find a navigation area with six sections:
- Event Overview: understand which events are coming from specific data sources
- Event Matching: understand what metadata parameters are included in your event data and what percentage of the time; understand your Event Match Quality score (EMQ)
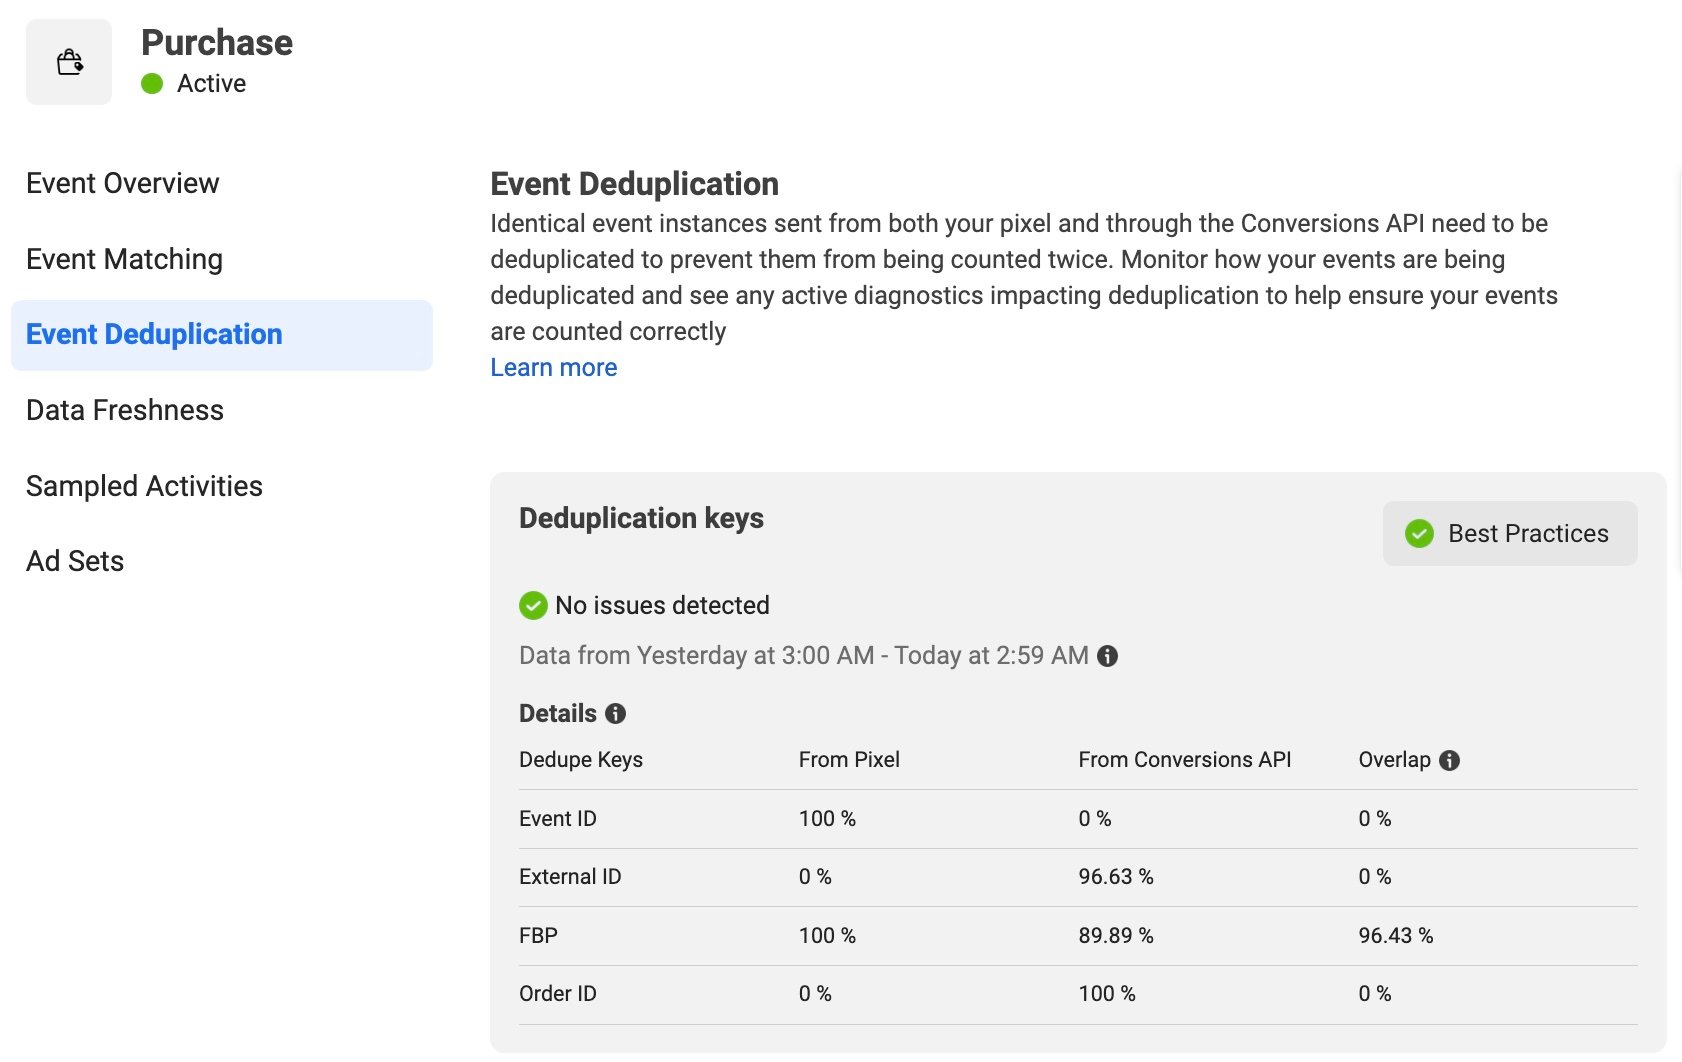
- Event Deduplication: understand what deduplication keys are being passed and whether your event deduplication across sources is working correctly
- Data Freshness: see how frequently your event data is being received by Facebook
- Sample Activities: see a scrollable list of actual events sent to your account; explore by timestamp and use to spot doubled events
- Ad Sets: see which Facebook ad campaigns are using the selected event as the primary optimization metric
Event Matching: The Importance of Data Precision
Event matching is a crucial part of Facebook analytics. Instead of a simple word like “Good”, hover over the “Rating breakdown” button to reveal a more detailed 0-10 scale. An 8.9 out of 10, for example, gives you a clearer idea of your data quality than just 'Good.' Keep in mind that the 'Good' score starts at different points for different events; for Purchase events, Good is over 8.0, while for ViewContent, Good is over 4.0.
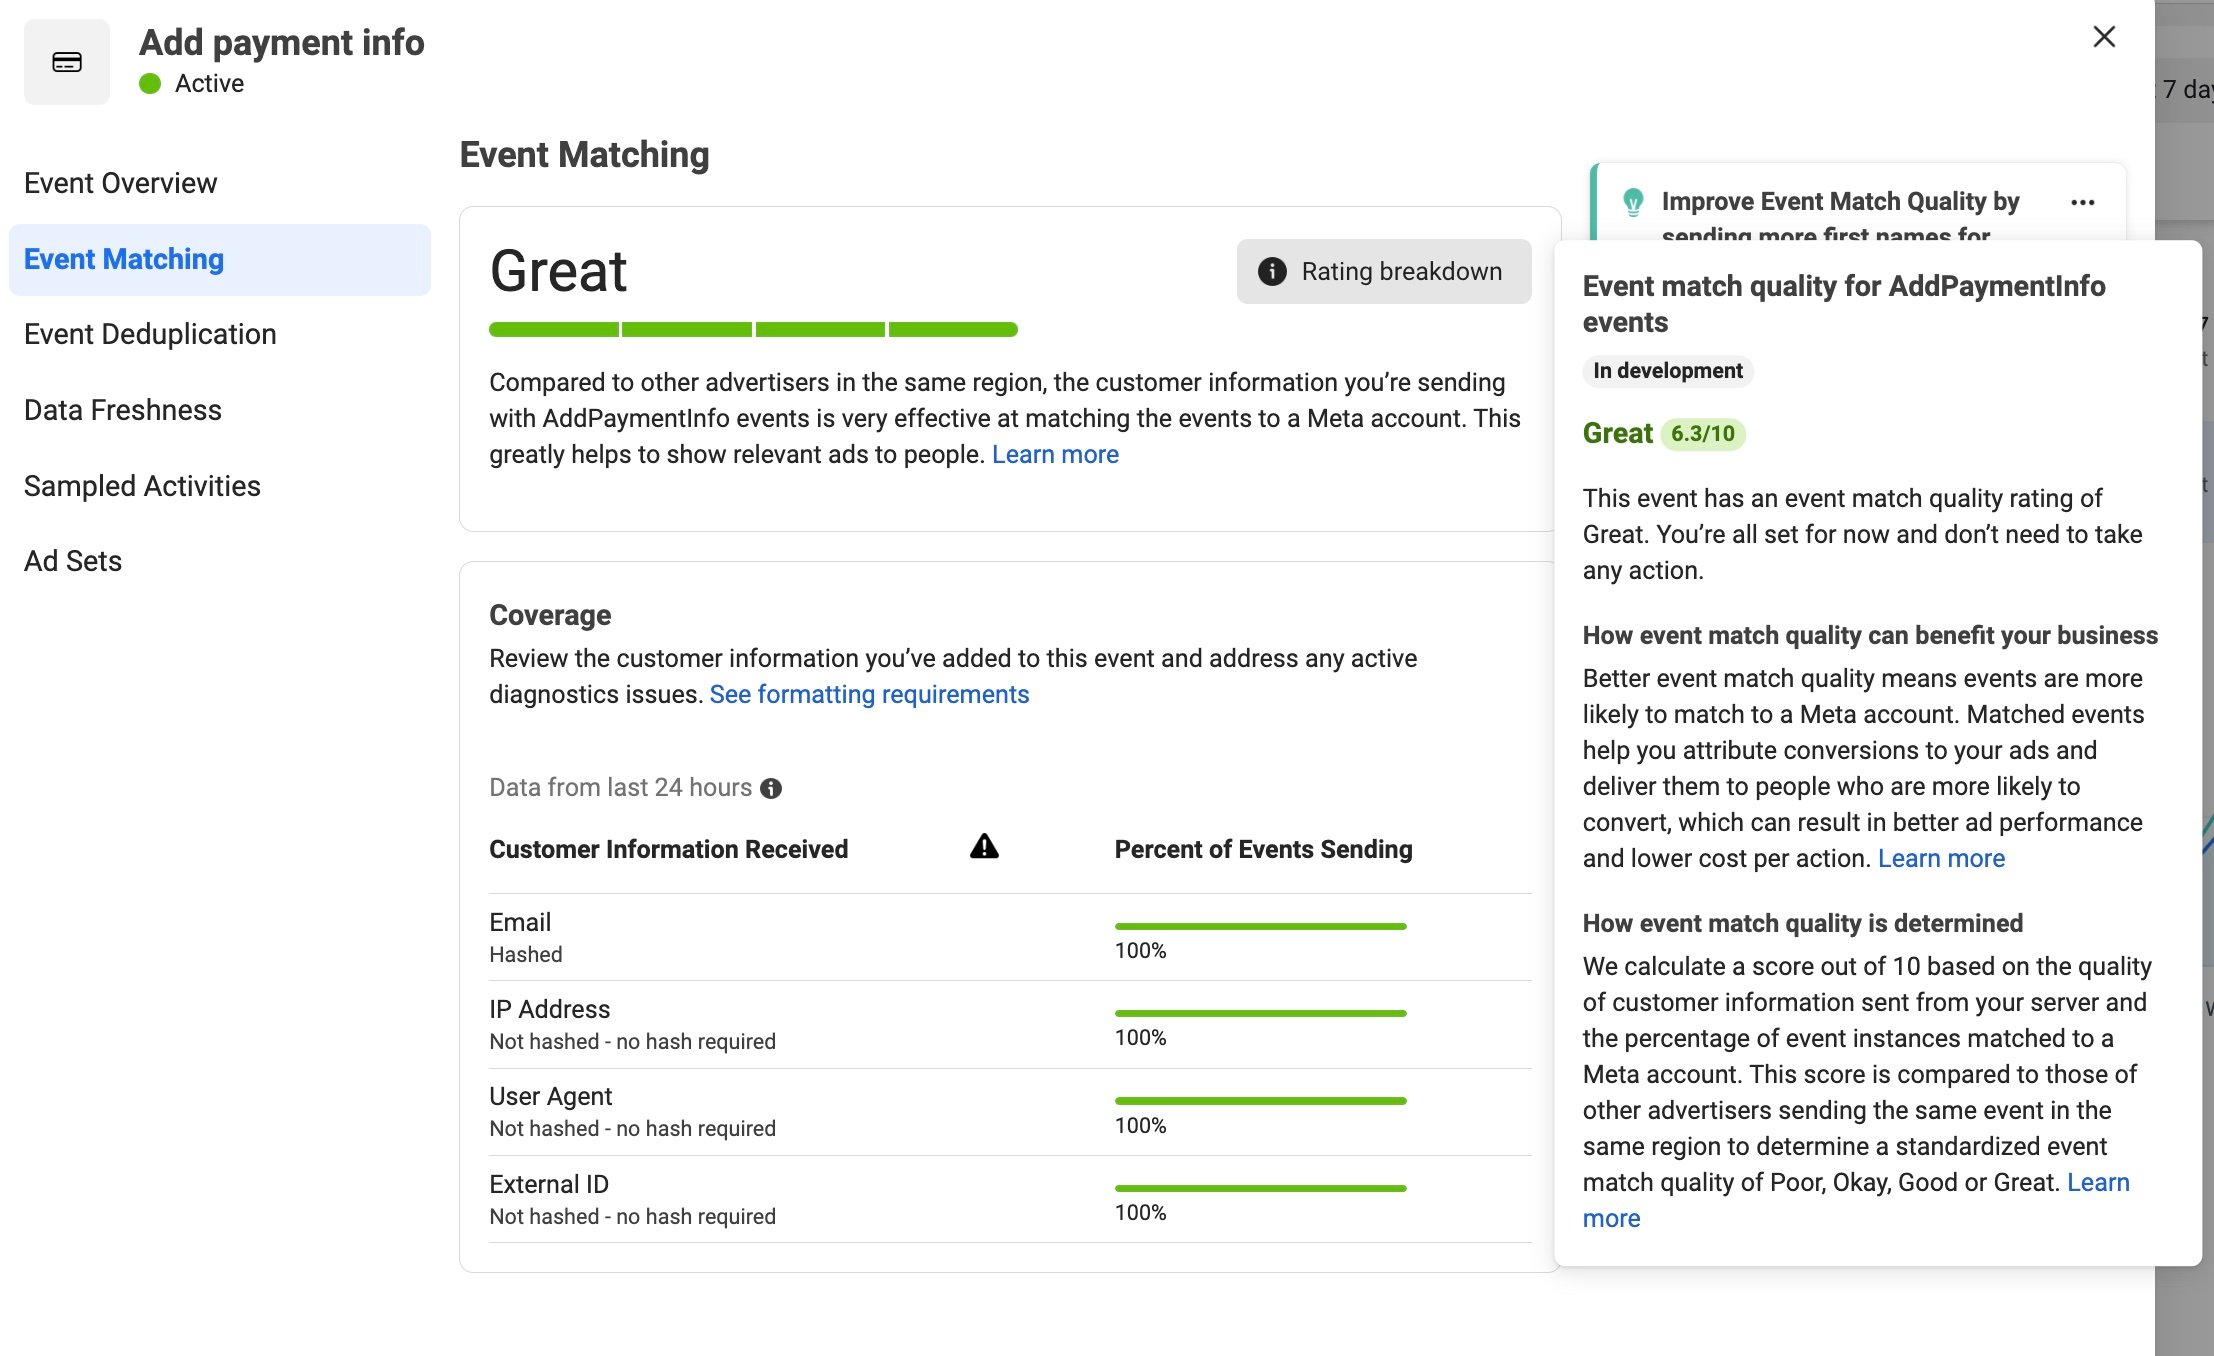
This score tells you the percentage of events received in the last 24 hours that contained each type of metadata that can be matched back to a specific Facebook/Meta user. The more metadata you send, the more likely Facebook can match to a user. This identity matching empowers Facebook's optimization capabilities because it allows the platform to find more users similar to the one tied to the event. Facebook’s ability to optimize is essentially powered by its identity-driven platform.
You should aim to send as many types of data as possible, with the percentage of those data types being as high as possible. However, it's important to note that not all data types can reach the same heights. For instance, the Facebook click ID (FBC) can't surpass the percentage of traffic coming from Facebook on your site. Certain data types are also correlated, such as zip code, country, city, and state, which are tied to IP addresses.
Event Deduplication: Maintaining Data Accuracy
Event deduplication is the process of identifying whether multiple event signals represent separate events or are essentially duplicates of the same event. Facebook uses fields like event ID (a unique ID for every event), external ID (a unique ID for every person), Facebook cookie (FBP), and order ID to deduplicate data effectively. Sending a diverse range of data aids in keeping your data clean and accurate, thereby training Facebook's machine learning system more effectively.
Additional Insights and Pitfalls
Remember, while your Events Manager views can help you understand issues related to data duplication, data freshness, and activity sampling, it's crucial to stay proactive in diagnosing any possible data irregularities. Although these tools provide invaluable insights, they should primarily be used as diagnostic tools. When you identify a problem, it typically means there's something about your data that requires attention.
One of the significant challenges facing Facebook users since iOS 14's launch in April 2021 is that Facebook now knows when people opt out of data sharing in an iOS app. Even if a user opts out in just one app on one of their devices, all data tied to that user coming from any device gets rejected by Facebook. However, this isn't reflected in the Events Manager.
The Events Manager is like a bouncer at the front door of a club—it knows who arrived and what data they brought, but it doesn't tell you who made it past the entrance. Facebook lacks transparency about how much of your data is used and how much is discarded. By their own estimates, 60% of all data is dropped because it matches to opted out users. That’s why 1st-party data connections like Popsixle are so valuable. They make more of your data usable and help fix the root cause of signal loss on Facebook/Meta.
Key Takeaways
In light of these challenges, it's essential to remember two things when using the Events Manager. Firstly, it's a diagnostic tool—it helps identify issues in your data that may need attention. Secondly, the Events Manager only tells you what data has been sent—it doesn't provide information on the data that actually made it into your ad account.
To overcome these challenges, it's crucial to maintain control over your data and terms of service. By doing so, you ensure that your data from your connections is being used for your account, regardless of any discrepancies that might arise from Facebook's data handling.
In summary, Facebook's Events Manager provides valuable insights and tools that can help optimize your advertising efforts. While it does have limitations, with an understanding of these and a proactive approach, you can harness this tool's power to significantly improve your ad campaigns' performance.
If your brand is experiencing poor performance, erratic performance, or inaccurate ad attribution within your Facebook ad account, Popsixle can help. Learn more about our 14-day trial that fixes the root cause of signal loss and helps you regain control of your Facebook ads.